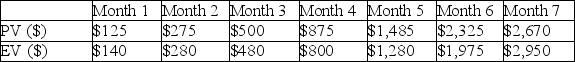
Use the information in the table regarding this seven-month project to create two plots. The first plot should be the S-curve for Earned Value. Indicate on this plot whether the project is ahead or behind schedule and by how much. The second plot should be the Earned Schedule and the Estimate at Completion for Time. Comment on the symmetry of this graph and whether you would expect a similar plot from any other project to exhibit similar characteristics.
Correct Answer:
Verified
View Answer
Unlock this answer now
Get Access to more Verified Answers free of charge
Q81: In the build-up stage of a successful
Q82: The Project Implementation Profile includes this critical
Q86: The closer to completion a project gets,the
Q93: What is the significance of the 0/100
Q94: Funding problems are a key success inhibitor
Q94: Use this earned schedule table to determine
Q96: Use this earned schedule table to determine
Q97: A recurring problem with establishing accurate or
Q102: Use the information in the table regarding
Q104: Briefly describe the important differences between Earned
Unlock this Answer For Free Now!
View this answer and more for free by performing one of the following actions

Scan the QR code to install the App and get 2 free unlocks

Unlock quizzes for free by uploading documents