Multiple Choice
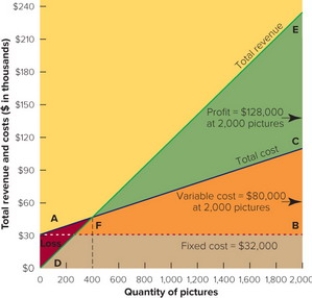 Figure 13-7A
-Figure 13-7 above depicts a
A) Gantt chart.
B) demand curve.
C) break-even chart.
D) ROI analysis.
E) cross-tabulation.
Correct Answer:
Verified
Related Questions
Q185: The break-even point (BEP) = [_ ÷
Unlock this Answer For Free Now!
View this answer and more for free by performing one of the following actions

Scan the QR code to install the App and get 2 free unlocks

Unlock quizzes for free by uploading documents