 Figure 13-4A
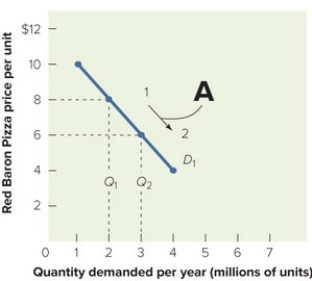
-Figure 13-4A above shows that when the price for Red Baron frozen cheese pizzas moves from $8 to $6 per unit along the demand curve D1, the profit
A) increases from 6 to 8 million units per year.
B) decreases from 8 to 6 million units per year.
C) stays the same.
D) increases from $2 to $3 per unit.
E) cannot be determined; demand curves do not show a relationship to profit.
Correct Answer:
Verified
Q144: Q145: Inelastic demand exists when Q146: If a firm finds the demand for Q147: A movement along a demand curve (up Q148: Recently, much of the western United States Q150: For the sake of simplicity and by Q151: Price elasticity of demand is expressed as Q152: Demand for a product is likely to Q153: Which of these illustrates movement along the Q154: Mrs. Renfro's, Inc., sells 25 different relishes![]()
A) a small percentage
A)
Unlock this Answer For Free Now!
View this answer and more for free by performing one of the following actions

Scan the QR code to install the App and get 2 free unlocks

Unlock quizzes for free by uploading documents