Use the figure below to answer the following question(s) .
Figure 4-7 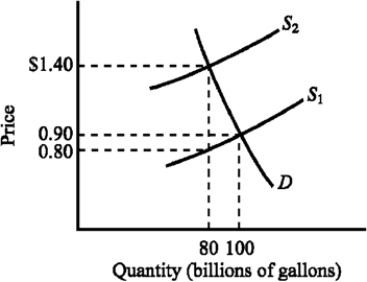
-Refer to Figure 4-7. The supply curve S1 and the demand curve D indicate initial conditions in the market for gasoline. A $.60-per-gallon excise tax on gasoline is levied, which shifts the supply curve from S1 to S2. Imposing the tax causes the equilibrium price of gasoline to increase from
A) $.80 to $1.40.
B) $.80 to $1.50.
C) $.90 to $1.50.
D) $.90 to $1.40.
Correct Answer:
Verified
Q18: Other things constant, a decrease in the
Q19: The General Theory of John Maynard Keynes
Q20: The Laffer curve illustrates the concept that
A)
Q21: Use the figure below to answer the
Unlock this Answer For Free Now!
View this answer and more for free by performing one of the following actions

Scan the QR code to install the App and get 2 free unlocks

Unlock quizzes for free by uploading documents