Figure 9-10 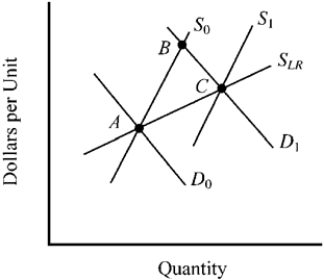
-In Figure 9-10, the movement from points A to B to C can best be explained by which of the following factors?
A) a decrease in demand, followed by the entry of new firms and an expansion in supply in a constant cost industry.
B) an increase in demand, followed by the entry of new firms and an expansion in supply in an increasing cost industry.
C) a decrease in demand, followed by the exit of firms and a decline in supply in an increasing cost industry.
D) an increase in demand, followed by the exit of firms and a decline in supply in a constant cost industry.
Correct Answer:
Verified
Q86: Use the figure to answer the following
Q87: Use the figure to answer the following
Q88: Figure 9-12 Q89: The graph below depicts the cost structure Q90: Use the figure to answer the following Q92: Use the figure to answer the following Q93: Use the figure to answer the following Q94: Use the figure to answer the following Q95: Use the figure to answer the following Q96: Use the figure to answer the following![]()
Unlock this Answer For Free Now!
View this answer and more for free by performing one of the following actions

Scan the QR code to install the App and get 2 free unlocks

Unlock quizzes for free by uploading documents