Multiple Choice
Figure 3-8 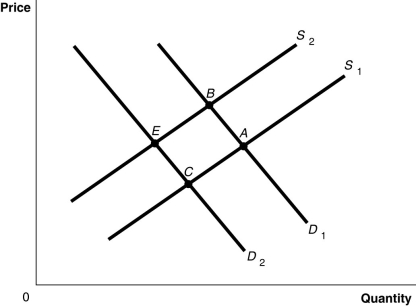
-Refer to Figure 3-8. The graph in this figure illustrates an initial competitive equilibrium in the market for apples at the intersection of D2 and S2 (point E) . Which of the following changes would cause the equilibrium to change to point A?
A) a positive change in the technology used to produce apples and decrease in the price of oranges, a substitute for apples
B) an increase in the wages of apple workers and a decrease in the price of oranges, a substitute for apples
C) an increase in the number of apple producers and a decrease in the number of apple trees as a result of disease
D) a decrease in the wages of apple workers and an increase in the price of oranges, a substitute for apples
Correct Answer:
Verified
Related Questions

