Figure 24-4 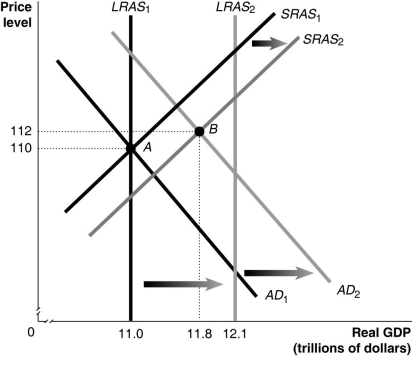
-Refer to Figure 24-4. In the figure above, LRAS1 and SRAS1 denote LRAS and SRAS in year 1, while LRAS2 and SRAS2 denote LRAS and SRAS in year 2. Given the economy is at point A in year 1, what is the growth rate in potential GDP in year 2?
A) 8%
B) 9.1%
C) 10%
D) 12%
Correct Answer:
Verified
Q201: In the long run
A)GDP = potential GDP.
B)unemployment
Q208: For the recession of 2007-2009,it took _
Q214: Which of the following is considered a
Q216: What is the relationship among the AD,SRAS
Q221: As the recession persisted into 2009,the unemployment
Q223: At the beginning of the recession of
Q224: Figure 24-4 Q225: Using aggregate demand and aggregate supply,explain what Q227: Figure 24-4 Q229: Using the aggregate supply and demand model,illustrate![]()
![]()
Unlock this Answer For Free Now!
View this answer and more for free by performing one of the following actions

Scan the QR code to install the App and get 2 free unlocks

Unlock quizzes for free by uploading documents