Six samples of size 10 were collected.The data are provided in the following table: The upper control limit (UCL) and lower control limit (LCL) for an s-chart are: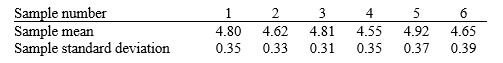
A) LCL = 0.2840, UCL = 1.7160.
B) LCL = 0.0994, UCL = 0.6006.
C) LCL = 4.6256, UCL = 5.3256.
D) LCL = 3.6750, UCL = 5.7750.
Correct Answer:
Verified
Q51: A _ is the result of some
Q52: Which of the following is NOT an
Q53: The _ is used to monitor
Q54: The s-chart is recommended when:
A)the control
Q55: A precision parts manufacturer produces bolts
Q57: Statistical process control relies on _.
A)process capability
Q58: Control limits are often confused with _.
A)pre-control
Q59: A company wishes to monitor the
Q60: Which of the following is NOT one
Q61: If the lower limit for a p-chart
Unlock this Answer For Free Now!
View this answer and more for free by performing one of the following actions

Scan the QR code to install the App and get 2 free unlocks

Unlock quizzes for free by uploading documents