Exhibit 10-2
A manager of a hotel chain is interested in investigating whether there is a relationship between staff labor hours and bed-day occupancy incurred by a hotel in a month.The manager randomly selected 17 of the hotels in the chain across the country and recorded, for each of the hotels, the staff's total labor hours for the month of July and the number of bed-days of occupancy for that month. (A hotel has occupied one "bed-day" if one bed is occupied (rented) for an entire day.) The manager is interested in seeing if the labor hours incurred can be predicted from the number of bed-days of occupancy on a monthly basis.
The sample data were analyzed using Excel.Shown below is part of the regression analysis output.
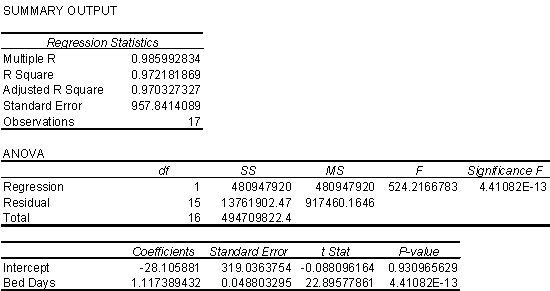
-Refer to Exhibit 10-2.According to this regression analysis,what is the predicted number of monthly labor hours required for a hotel with 3000 bed-day of occupancy for the month?
A) 4441.5
B) 3352.2
C) 4106.2
D) 3882.8
Correct Answer:
Verified
Q38: A sample of size sixteen is randomly
Q39: A manager at a local manufacturing company
Q40: Statistical thinking is a philosophy of learning
Q41: A manager at a market research firm
Q42: Special causes of variation are often called
Q44: Exhibit 10-3
An engineer collected data from three
Q45: Understanding processes provides the context for determining
Q46: Sample _ are often used as estimators
Q47: Exhibit 10-3
An engineer collected data from three
Q53: A government report gives a 99% confidence
Unlock this Answer For Free Now!
View this answer and more for free by performing one of the following actions

Scan the QR code to install the App and get 2 free unlocks

Unlock quizzes for free by uploading documents