Use the figure below to answer the following questions.
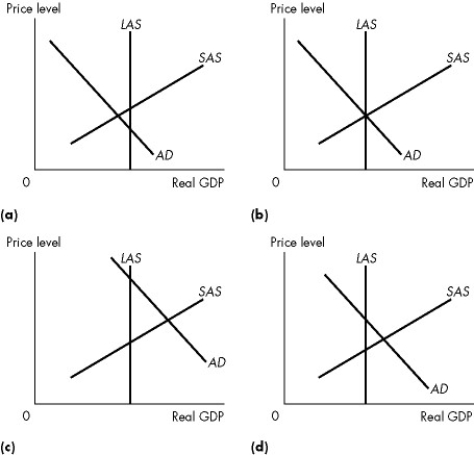
Figure 26.3.3
-Refer to Figure 26.3.3. Which one of the graphs illustrates a full-employment equilibrium?
A) (a) only
B) (b) only
C) (c) only
D) (d) only
E) (c) and (d)
Correct Answer:
Verified
Q91: Beginning at a long-run equilibrium, an increase
Q92: Use the table below to answer the
Q93: We observe a decrease in the price
Q94: We observe a decrease in the price
Q95: The economy cannot remain indefinitely with real
Q97: Use the table below to answer the
Q98: Use the figure below to answer the
Q99: If real GDP is less than potential
Q100: We observe an increase in the price
Q101: All of the following will raise the
Unlock this Answer For Free Now!
View this answer and more for free by performing one of the following actions

Scan the QR code to install the App and get 2 free unlocks

Unlock quizzes for free by uploading documents