Use the figure below to answer the following questions.
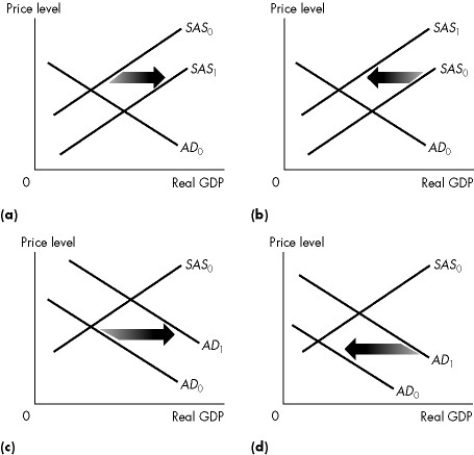
Figure 26.2.1
-Refer to Figure 26.2.1.Which graph illustrates what happens when the quantity of money decreases?
A) (a)
B) (b)
C) (c)
D) (d)
E) None of the above
Correct Answer:
Verified
Q42: Use the figure below to answer the
Q45: Which one of the following newspaper quotations
Q48: Use the figure below to answer the
Q49: Which of the following does not change
Q50: An inflationary gap is the amount by
Q52: When the actual unemployment rate is equal
Q57: Which one of the following shifts the
Q61: Use the figure below to answer the
Q63: Use the figure below to answer the
Q72: When an economy is operating on its
Unlock this Answer For Free Now!
View this answer and more for free by performing one of the following actions

Scan the QR code to install the App and get 2 free unlocks

Unlock quizzes for free by uploading documents