Use the figure below to answer the following questions.
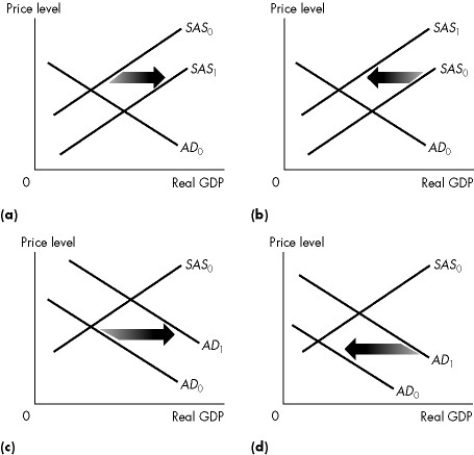
Figure 26.2.1
-Refer to Figure 26.2.1.Which graph illustrates what happens when government expenditure increases?
A) (a)
B) (b)
C) (c)
D) (d)
E) None of the above
Correct Answer:
Verified
Q42: A recessionary gap is the amount by
Q44: Full-employment equilibrium occurs when
A)aggregate demand equals short-run
Q52: Use the figure below to answer the
Q54: Which one of the following is a
Q55: Everything else remaining the same, an increase
Q57: Which one of the following shifts the
Q58: Use the figure below to answer the
Q66: Use the figure below to answer the
Q79: Use the figure below to answer the
Q80: Use the figure below to answer the
Unlock this Answer For Free Now!
View this answer and more for free by performing one of the following actions

Scan the QR code to install the App and get 2 free unlocks

Unlock quizzes for free by uploading documents