Use the figure below to answer the following questions.
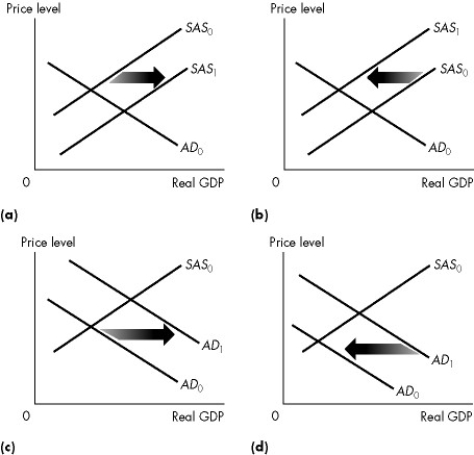
Figure 26.1.1
-Refer to Figure 26.1.1. Which graph illustrates what happens when factor prices decrease?
A) (a)
B) (b)
C) (c)
D) (d)
E) (a) and (b)
Correct Answer:
Verified
Q9: Potential GDP
A)increases as the price level rises.
B)is
Q10: The long-run aggregate supply curve is vertical
Q11: If the money wage rate falls, then
A)the
Q12: The short-run aggregate supply curve is the
Q13: The long-run aggregate supply curve is
A)vertical.
B)negatively sloped.
C)positively
Q15: Which one, if any, of the following
Q16: Which one of the following newspaper quotations
Q17: Everything else remaining the same, the short-run
Q18: An increase in oil prices to a
Q19: A technological advance shifts
A)both SAS and AD
Unlock this Answer For Free Now!
View this answer and more for free by performing one of the following actions

Scan the QR code to install the App and get 2 free unlocks

Unlock quizzes for free by uploading documents