Use the figure below to answer the following questions.
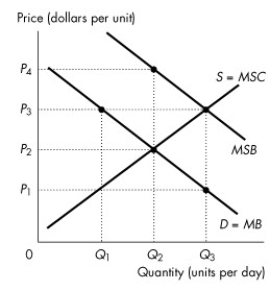
Figure 16.3.1
-Refer to Figure 16.3.1.The figure shows the marginal private benefit curve,the marginal social benefit curve,and the market supply curve.If a subsidy is granted that generates an efficient quantity,then quantity produced is
A) zero.
B) Q1.
C) Q2.
D) Q3.
E) greater than Q1.
Correct Answer:
Verified
Q51: If the production of a good creates
Q53: When Good A is produced,pollution is also
Q63: Use the figure below to answer the
Q71: Use the figure below to answer the
Q74: All of the following statements about emission
Q74: The marginal private benefit curve (MB)is a
Q75: Use the figure below to answer the
Q79: A chemical factory and a fishing club
Q79: Use the table below to answer the
Q83: Use the table below to answer the
Unlock this Answer For Free Now!
View this answer and more for free by performing one of the following actions

Scan the QR code to install the App and get 2 free unlocks

Unlock quizzes for free by uploading documents