Which graph in the figures below is a plot of a linear behavior? 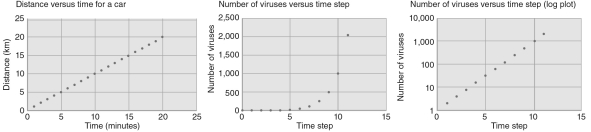
A) figure (a)
B) figure (b)
C) figure (c)
D) none of these
E) all three graphs
Correct Answer:
Verified
Q70: The study of whether or not life
Q71: When we look at distant objects, we
Q72: What implication does the finite speed of
Q73: What does the word dark mean in
Q74: Suppose you were writing to a pen
Q76: What are the units of the vertical
Q77: What is the Local Group?
Q78: Using the method of comparing times to
Q79: Explain the scientific definitions for the terms
Q80: Approximately how many viruses are there at
Unlock this Answer For Free Now!
View this answer and more for free by performing one of the following actions

Scan the QR code to install the App and get 2 free unlocks

Unlock quizzes for free by uploading documents