Use the figure below to answer the following questions.
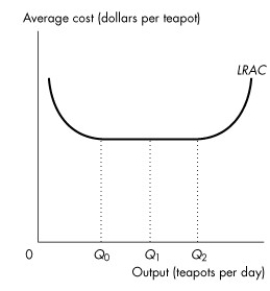
Figure 11.4.4
-Refer to Figure 11.4.4, which illustrates the long-run average total cost curve. Given an increase in output from Q₁ to Q₂,
A) economies of scale exist.
B) diseconomies of scale exist.
C) constant returns to scale exist.
D) average total cost is increasing.
E) average total cost is decreasing.
Correct Answer:
Verified
Q119: A production function is the relationship between
Q120: Use the figure below to answer the
Q121: Use the figure below to answer the
Q122: Use the table below to answer the
Q122: If constant returns to scale are present,
A)average
Q123: Which type of cost does not change
Q125: Use the figure below to answer the
Q127: Suppose a candy manufacturer can triple its
Q128: The long-run average cost curve is the
Q143: Economies of scale refer to the range
Unlock this Answer For Free Now!
View this answer and more for free by performing one of the following actions

Scan the QR code to install the App and get 2 free unlocks

Unlock quizzes for free by uploading documents