Use the figure below to answer the following question.
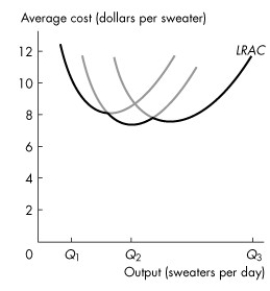
Figure 11.4.3
-Refer to Figure 11.4.3 which shows a firm's long-run average total cost curve. An increase in production from Q₁ to Q₂ sweaters per day produces
A) the minimum efficient scale.
B) economies of scale.
C) diseconomies of scale.
D) constant total costs.
E) constant returns to scale.
Correct Answer:
Verified
Q124: Diseconomies of scale are present when
A)the LRAC
Q126: The marginal product of capital is the
A)change
Q133: If diseconomies of scale are present,
A)average total
Q134: Suppose Honda can triple its production of
Q134: Economies of scale are present when
A)the LRAC
Q139: Use the figure below to answer the
Q141: The minimum efficient scale is the smallest
Q142: A firm experiences _ when its _
Q144: One reason for diseconomies of scale is
Q145: Diseconomies of scale refer to the range
Unlock this Answer For Free Now!
View this answer and more for free by performing one of the following actions

Scan the QR code to install the App and get 2 free unlocks

Unlock quizzes for free by uploading documents