Use the figure below to answer the following questions.
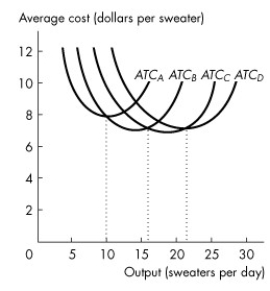
Figure 11.4.2
-Refer to Figure 11.4.2, which illustrates the short-run average total cost curves for four different plant sizes.Which curve represents the average total cost for the largest of the four plant sizes?
A) ATCA
B) ATCB
C) ATCC
D) ATCD
E) either ATCC or ATCD
Correct Answer:
Verified
Q121: Use the figure below to answer the
Q126: The marginal product of capital is the
A)change
Q127: Suppose a candy manufacturer can triple its
Q128: The long-run average cost curve is the
Q131: Use the figure below to answer the
Q133: If diseconomies of scale are present,
A)average total
Q134: Economies of scale are present when
A)the LRAC
Q134: Suppose Honda can triple its production of
Q137: Use the figure below to answer the
Q141: The minimum efficient scale is the smallest
Unlock this Answer For Free Now!
View this answer and more for free by performing one of the following actions

Scan the QR code to install the App and get 2 free unlocks

Unlock quizzes for free by uploading documents