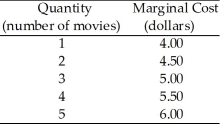
Table 5.2.3

-Consider the demand and supply curves in Figure 5.2.3. If the market is at the competitive equilibrium, which area in the diagram indicates the cost of producing the quantity sold?
A) ABC
B) AEC
C) EBC
D) 0BCD
E) 0ECD
Correct Answer:
Verified
Q46: Sally and Eric are the only people
Q46: Suppose that the Hot Dog House can
Q48: The marginal cost of producing one more
Q49: Marginal cost
A)is always less than price.
B)can be
Q50: What is the producer surplus for the
Q53: An oil painting has a marginal cost
Q54: If we produce one more bottle of
Q55: A supply curve is
A)the same as a
Q55: Consumer surplus
A)will definitely be low for inexpensive
Q59: The marginal cost of producing an additional
Unlock this Answer For Free Now!
View this answer and more for free by performing one of the following actions

Scan the QR code to install the App and get 2 free unlocks

Unlock quizzes for free by uploading documents