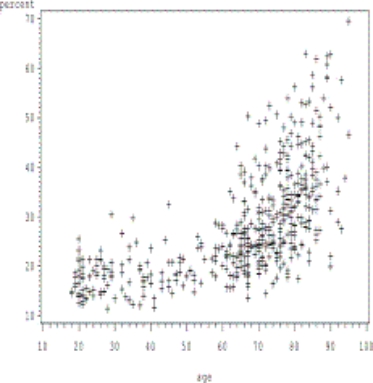
The following figure shows a scatter plot of the percent of bone loss by age. It has been suggested that there is a linear relationship between age and percent of bone loss. Is there evidence of a linear relationship in this sample? Explain
Correct Answer:
Verified
View Answer
Unlock this answer now
Get Access to more Verified Answers free of charge
Q8: What can be said about R² when
Q9: When a child is born, he/she may
Q10: In a meeting with a biostatistician to
Q11: Data were collected on soy protein consumption
Q12: A multiple linear regression analysis is employed
Q14: A colleague was asked to present his
Q15: An investigator has conducted a study where
Q16: Define multicollinearity. Provide an example where multicollinearity
Q17: In the scatter plot, some points do
Q18: Which of the following correlation coefficient estimates
Unlock this Answer For Free Now!
View this answer and more for free by performing one of the following actions

Scan the QR code to install the App and get 2 free unlocks

Unlock quizzes for free by uploading documents