What does the following graph show? 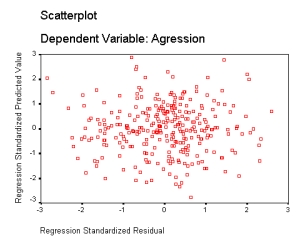
A) Heteroscedasticity
B) Non-linearity
C) Heteroscedasticity and non-linearity
D) Regression assumptions that have been met
Correct Answer:
Verified
Q1: The distance of cases from the model
Q2: What is multicollinearity?
A)When predictor variables correlate very
Q3: Which of the following statements about the
Q3: A researcher had a categorical variable that
Q6: What is R2?
A) The percentage of variance
Q7: Which of these statements is not true?
A)
Q10: A way of representing discrete variables in
Q15: Which of the following is not a
Q16: When making assumptions about regression analysis, which
Q19: Which of the following statements about outliers
Unlock this Answer For Free Now!
View this answer and more for free by performing one of the following actions

Scan the QR code to install the App and get 2 free unlocks

Unlock quizzes for free by uploading documents