Which of the following statements best describes the graph below? 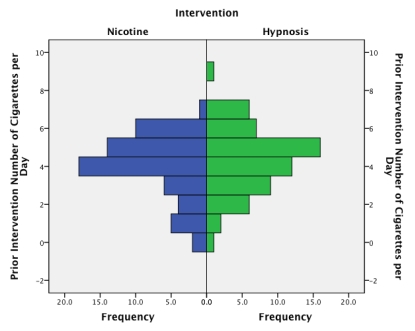
A) The graph shows that for those who used nicotine patches there is a fairly normal distribution,whereas those who used hypnosis show a skewed distribution,where a very small proportion of people (relative to those using nicotine) smoke more than 2 cigarettes per day.
B) The graph shows that for those who used hypnosis there is a fairly normal distribution,whereas those who used nicotine patches show a skewed distribution,where a very large proportion of people (relative to those using nicotine) smoke less than 4 cigarettes per day.
C) The graph looks fairly unsymmetrical,indicating that the two groups are from different populations.
D) The graph looks fairly symmetrical.This indicates that both groups had a similar spread of scores before the intervention.
Correct Answer:
Verified
Q3: Imagine we took a group of smokers,
Q13: What can we say about the graph
Q14: Looking at the graph below,which intervention was
Q15: A study was done to investigate the
Q16: What does the graph below show?
Q17: What is the graph below known as?
Q20: Approximately what is the median success score
Q21: We took a sample of children who
Q22: The graph below shows the mean success
Q23: We took a sample of children who
Unlock this Answer For Free Now!
View this answer and more for free by performing one of the following actions

Scan the QR code to install the App and get 2 free unlocks

Unlock quizzes for free by uploading documents