Consider this graph modelling the influence of an intervention on company financial performance.What is shown in the graph? 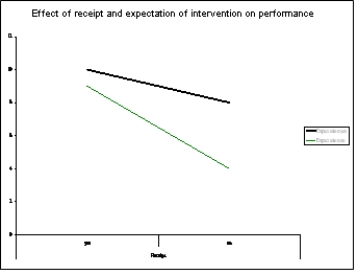
A) There is an interaction and no main effects.
B) There is one main effect and no interaction.
C) There are two main effects and no interaction.
D) There is an interaction and two main effects.
Correct Answer:
Verified
Q1: Which procedure would not have been suitable
Q3: Which of the following is not a
Q5: What would the substantive interpretation of this
Q7: Research was conducted in which employees were
Q9: How many dependent variables does a two-way
Q11: Which of the following questions should not
Q12: If a study has employed a two-way
Q13: An experiment was conducted to look at
Q14: Breaking down the total variance is referred
Q14: In the same context as Q4,consider the
Unlock this Answer For Free Now!
View this answer and more for free by performing one of the following actions

Scan the QR code to install the App and get 2 free unlocks

Unlock quizzes for free by uploading documents