The figure below shows the number of predatory attacks per individual in water skater groups of different sizes. The information in the graph demonstrates which benefit of grouping? 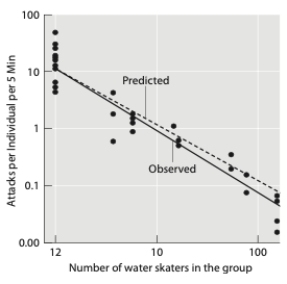
A) increased vigilance
B) dilution
C) group defense
D) cooperative foraging
E) There is no benefit.
Correct Answer:
Verified
Q50: You are studying crickets and notice that
Q51: In the paper wasp, although all females
Q52: Describe the two hypotheses related to the
Q53: Dictyostelium discoides, also known as cellular slime
Q54: Critique the following statement: Some individuals in
Q55: Which of the following is true regarding
Q57: A new altruistic allele arises in a
Q58: When population density is high and food
Q59: Is it theoretically possible for altruistic behavior
Q60: In what way(s) do(es) Aplysia flexibly respond
Unlock this Answer For Free Now!
View this answer and more for free by performing one of the following actions

Scan the QR code to install the App and get 2 free unlocks

Unlock quizzes for free by uploading documents