The graph below shows results of two simulations, both depicting the rise in frequency of a beneficial allele in a population of infinite size. The selection coefficient and the starting frequency are the same, but in one simulation the beneficial allele is dominant and in the other it is recessive. Neither allele is fixed by 500 generations. 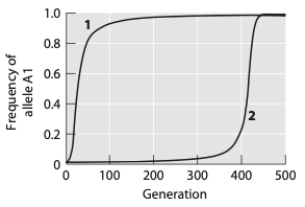 (a) Which simulation shows results for a dominant and which shows results for a recessive allele? How can you tell?
(b) Neither of the alleles reaches fixation by 500 generations. If given enough time, will both of these alleles reach fixation in the population? Why or why not?
Correct Answer:
Verified
Q54: In a population of ground beetles, a
Q55: The graphs below show the results of
Q56: The graph below depicts the change in
Q57: You collect the following data on genotypes
Q58: When FST ≈ 0, a population
A) has
Q60: Some Drosophila melanogaster larvae use a "sitting"
Q61: A researcher performs an experiment on fruit
Q62: Contrast evolution by natural selection with evolution
Q63: Considering the principles of mutation, natural selection,
Q64: Explain how landscape genetics can influence the
Unlock this Answer For Free Now!
View this answer and more for free by performing one of the following actions

Scan the QR code to install the App and get 2 free unlocks

Unlock quizzes for free by uploading documents