The graph below shows the change in allele frequency for a beneficial allele over time (the x axis shows generations) . Based on the shape of the curve, this allele is most likely 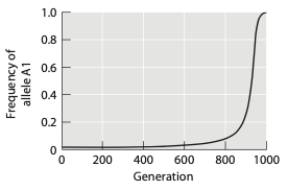
A) homozygous.
B) dominant.
C) recessive.
D) heterozygous.
E) additive.
Correct Answer:
Verified
Q11: Which of the following is not true
Q12: In comparison with genetic drift, evolution by
Q13: Tasmanian devils once inhabited most of present-day
Q14: Which of the following is an example
Q15: Alleles are
A) found at genetic loci.
B) always
Q17: Why was Charles II of Spain, of
Q18: A genetic bottleneck occurs when
A) there is
Q19: Although the Ester1 allele confers a selective
Q20: In a population of butterflies that has
Q21: If a population is in Hardy-Weinberg equilibrium
Unlock this Answer For Free Now!
View this answer and more for free by performing one of the following actions

Scan the QR code to install the App and get 2 free unlocks

Unlock quizzes for free by uploading documents