(Figure: Graph Examples) Which graph is an example of a scatter plot? 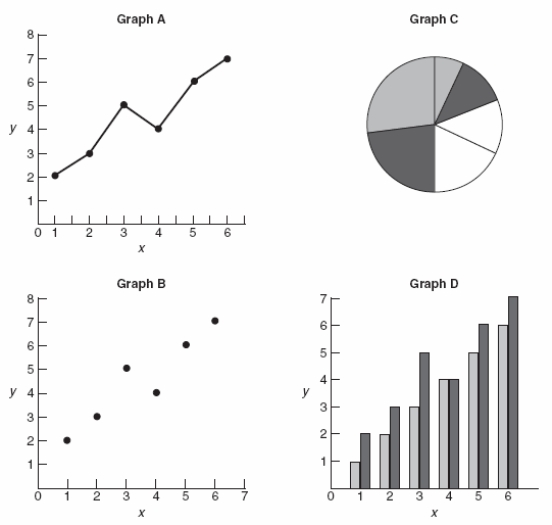
A) graph A
B) graph B
C) graph C
D) graph D
Correct Answer:
Verified
Q162: (Figure: Weight Loss and Exercise Time) According
Q163: (Figure: Mileage and Speed by Car Weight)
Q164: (Table) If the numbers in the
Q166: (Table) If the numbers in the
Q167: (Figure: Crop Yield and Fertilizer) The graph
Q168: If temperature and ice cream sales are
Q200: A graph of a business cycle that
Q230: Economists generally do NOT define an institution
Q248: Pie charts
A) depict two variables to see
Q279: If you plot temperature on the y
Unlock this Answer For Free Now!
View this answer and more for free by performing one of the following actions

Scan the QR code to install the App and get 2 free unlocks

Unlock quizzes for free by uploading documents