(Figure: Interpreting PPF Shifts 3) Which statement would NOT be a possible explanation for the shift depicted in the graph? 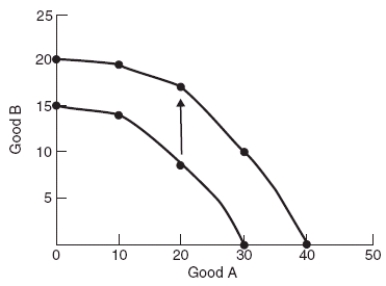
A) Workers receive more education.
B) New technology is developed.
C) Unemployment rises.
D) New energy resources are found.
Correct Answer:
Verified
Q136: (Table) Given the production possibilities schedule
Q138: (Table) The table shows the number
Q139: (Figure: Bread and Honey) In the graph,
Q142: An increase in the quantity and/or quality
Q143: Which is NOT a source of economic
Q144: When a country is operating at its
Q145: If a society's production possibilities frontier shifts
Q146: (Table: Production Possibilities Schedule) In the
Q147: Increasing opportunity costs occur along the production
Q151: In an eight-hour day, Isabel can produce
Unlock this Answer For Free Now!
View this answer and more for free by performing one of the following actions

Scan the QR code to install the App and get 2 free unlocks

Unlock quizzes for free by uploading documents