(Figure: Determining Total Surplus) In the graph, total surplus is shown by area: 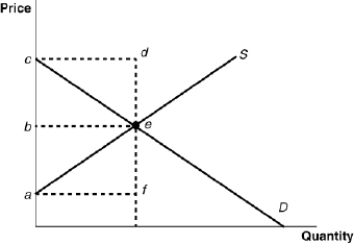
A) acdf.
B) ace.
C) bce.
D) abe.
Correct Answer:
Verified
Q91: (Figure: Understanding Surplus and Efficiency) In the
Q92: (Figure: Determining Total Surplus) In the graph,
Q93: (Figure: Determining Surplus 6) The maximum possible
Q94: (Figure: Determining Surplus 5) According to the
Q96: When supply of a product increases, ceteris
Q97: (Figure: Determining Surplus 6) Using the graph,
Q98: (Figure: Understanding Surplus and Efficiency) In the
Q99: At the equilibrium price:
A) either a shortage
Q199: When demand for a product falls, ceteris
Q267: The measure of society's benefits due to
Unlock this Answer For Free Now!
View this answer and more for free by performing one of the following actions

Scan the QR code to install the App and get 2 free unlocks

Unlock quizzes for free by uploading documents