Consider the following Phillips curve diagram: 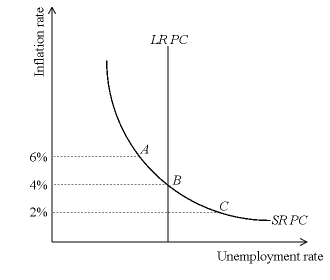 For the case where the economy is at Point A, Point B, or Point C, explain:
(a) whether actual inflation is above or below expected inflation (What is each exactly?)
(b) the likely shift in the short-run Phillips curve
(c) the likely change in unemployment
Correct Answer:
Verified
(a) Actu...
View Answer
Unlock this answer now
Get Access to more Verified Answers free of charge
Q22: Demonstrate graphically, how globalization has changed the
Q142: Non-economists often say that inflation makes the
Q146: Economist's understanding of the costs and benefits
Q151: How is the quantity theory of money
Q154: Explain how the quantity theory of money
Q157: How has globalization changed the nature of
Q164: Suppose the money supply is $100 billion
Q169: Assume the money supply is $1000,the velocity
Q170: Explain how institutionally-focused economists use the price-setting
Q173: Economists who believe in the quantity theory
Unlock this Answer For Free Now!
View this answer and more for free by performing one of the following actions

Scan the QR code to install the App and get 2 free unlocks

Unlock quizzes for free by uploading documents