Refer to the graph below. 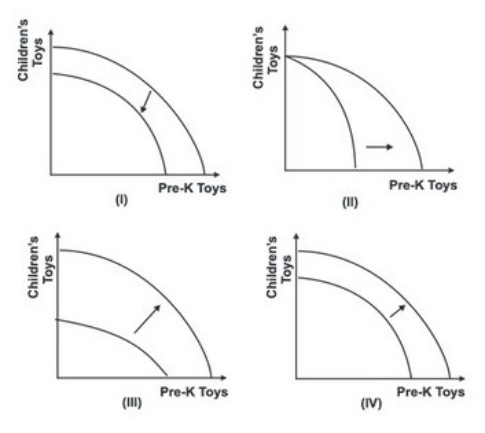 Which of the shifts explains what would happen to the production possibility curve if improved technologies increased the production of prekindergarten (Pre-K) toys by 25 percent and the production of children's toys by 50 percent?
A) I
B) II
C) III
D) IV
Correct Answer:
Verified
Q47: In election campaigns, presidents often promise more
Q48: Refer to the graph below. 
Q48: Which of the following is the best
Q50: Refer to the graph shown. Destruction of
Q51: Refer to the graph below.
Q52: According to Adam Smith, individuals are directed
Q53: Refer to the graph below.
Q54: Refer to the graph below.
Q55: If no resources had a comparative advantage
Q55: Refer to the graphs shown. The discovery
Unlock this Answer For Free Now!
View this answer and more for free by performing one of the following actions

Scan the QR code to install the App and get 2 free unlocks

Unlock quizzes for free by uploading documents