Refer to the following graph. 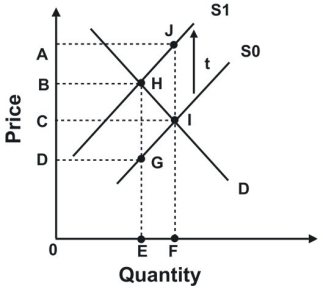 If this graph represents the supply of and demand for an imported product, a tariff of t will result in revenue for the government shown by area:
A) ACIJ.
B) BDGH.
C) BOEH.
D) DOEG.
Correct Answer:
Verified
Q61: Which price ceiling will cause the greatest
Q66: If the government imposes an excise tax
Q77: Refer to the graph shown. If government
Q78: Refer to the graph shown. Without government
Q81: Refer to the graph shown that depicts
Q83: Refer to the following graph. 
Q85: Refer to the graph shown that depicts
Q86: Refer to the graph shown. Given supply,
Q87: Refer to the graph shown. A quantity
Q99: Quantity restrictions become more valuable to those
Unlock this Answer For Free Now!
View this answer and more for free by performing one of the following actions

Scan the QR code to install the App and get 2 free unlocks

Unlock quizzes for free by uploading documents