Refer to the following graphs. 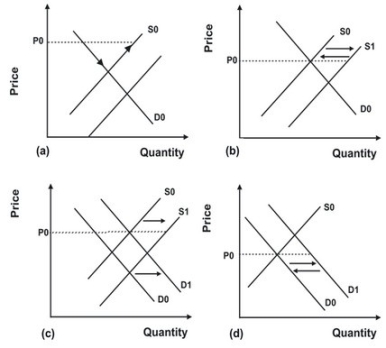 In the early 1990s, mounds of newspapers and worthless plastic piled up at recycling centers. As the nation's economy continued to grow, increased demand eliminated the mounds and turned them into shortages. In the mid-1990s, as recycling became more popular, the mounds of recycled materials returned. What graph best depicts these events on the market for recycled materials?
A) Price remained constant at P0. Quantity demanded first rose, while supply remained constant; quantity supplied then rose, while demand remained constant.
B) Price remained constant at P0. Supply first shifted from S1 to S0 and then back to S1.
C) Price remained constant at P0. Demand shifted from D0 to D1 then supply shifted from S0 to S1.
D) Price remained constant at P0. Demand shifted from D0 to D1 and then back to D0.
Correct Answer:
Verified
Q44: Fishing for king crabs for a living
Q45: Suppose the equilibrium price of oranges is
Q49: Refer to the following graph. 
Q49: An effective price ceiling is best defined
Q51: An increase in the Federal minimum wage,
Q52: Some years ago, Stuyvesant Town and Peter
Q53: When the polio vaccine first became available
Q58: Stricter environmental regulations and increased demand for
Q59: A number of states have a minimum
Q60: When people heard that there was a
Unlock this Answer For Free Now!
View this answer and more for free by performing one of the following actions

Scan the QR code to install the App and get 2 free unlocks

Unlock quizzes for free by uploading documents