Refer to the graph shown. Area C plus area E is: 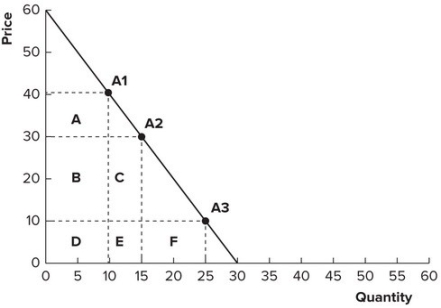
A) smaller than area A, because demand is elastic between $30 and $40.
B) larger than area A, because demand is inelastic between $30 and $40.
C) smaller than area A, because demand is inelastic between $30 and $40.
D) larger than area A, because demand is elastic between $30 and $40.
Correct Answer:
Verified
Q121: Refer to the graph shown. Area F
Q123: Income elasticity is defined as the:
A) change
Q125: Refer to the graph shown. Between points
Q127: Refer to the graph shown. Total revenue
Q127: It is estimated that a 10 percent
Q130: Refer to the graph shown. Between points
Q131: For necessities, income elasticity is any value:
A)
Q131: Refer to the graph shown. When price
Q137: An economist estimates that with every 20
Q138: An economist estimates that on average, for
Unlock this Answer For Free Now!
View this answer and more for free by performing one of the following actions

Scan the QR code to install the App and get 2 free unlocks

Unlock quizzes for free by uploading documents