Refer to the graph shown. When price declines by 11 percent, quantity supplied falls by 8 percent. Which curve best demonstrates the elasticity in this example? 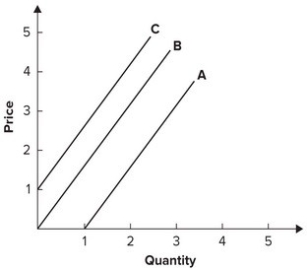
A) A
B) B
C) C
D) None of the answers is correct.
Correct Answer:
Verified
Q91: Refer to the graph shown. At which
Q92: Refer to the graph shown. Which supply
Q93: Refer to the graph shown. When price
Q94: Refer to the graph shown. For which
Q94: The supply curve with the greatest elasticity
Q95: Refer to the following graph. 
Q97: Refer to the graph shown. When price
Q98: Refer to the graph shown. Which point
Q99: Refer to the following graph.
Q101: Refer to the following table to
Unlock this Answer For Free Now!
View this answer and more for free by performing one of the following actions

Scan the QR code to install the App and get 2 free unlocks

Unlock quizzes for free by uploading documents