Refer to the graph shown. Economic output in year 0 is $50 billion. What is potential output in year 3? 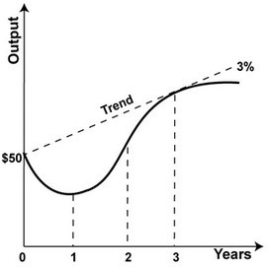
A) $47.0 billion
B) $50 billion
C) $54.6 billion
D) $56.3 billion
Correct Answer:
Verified
Q26: In order for the economy to return
Q27: Refer to the graph. Economic output in
Q28: If the structural stagnation hypothesis is correct,
Q29: Refer to the graph. Q30: What does the structural stagnation hypothesis say Q32: Refer to the graph. Economic output in Q33: Refer to the graph. The economy begins Q34: Refer to the graph. Economic output in Q35: The hypothesis about the macro economy that Q36: Structural stagnation is used to describe a:![]()
A)downturn,
Unlock this Answer For Free Now!
View this answer and more for free by performing one of the following actions

Scan the QR code to install the App and get 2 free unlocks

Unlock quizzes for free by uploading documents