In the graph shown, what change would increase production efficiency? 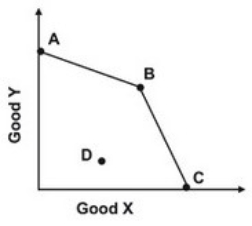
A) Moving from A to D
B) Moving from A to B
C) Moving from C to D
D) Moving from D to B
Correct Answer:
Verified
Q31: To graphically demonstrate the principle of increasing
Q32: Increasing marginal opportunity cost means that the
Q33: Refer to the graph below. 
Q34: Given a production possibility curve for good
Q35: If you move from a point inside
Q37: Refer to the graph shown. In the
Q38: Refer to the graph below.
Q39: Given the production possibility curve shown below,
Q40: The principle of increasing marginal opportunity cost
Q41: Refer to the graph below.
Unlock this Answer For Free Now!
View this answer and more for free by performing one of the following actions

Scan the QR code to install the App and get 2 free unlocks

Unlock quizzes for free by uploading documents