The following graph shows the supply of movie downloads. If price changes from $0.50 to $2.00, what will be the change in the market quantity supplied? 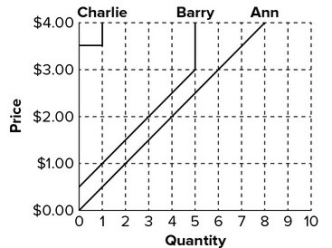
A) 1 movie per week
B) 6 movie per week
C) 7 movie per week
D) 8 movie per week
Correct Answer:
Verified
Q84: The following graph shows the supply of
Q85: The following graph shows the supply of
Q86: Which curve shown below represents the
Q87: If the price in a market is
Q88: When the going rate is $10.00 per
Q90: Which of the following would be expected
Q91: Refer to the graph shown. Suppose that
Q92: In the early 2000s car sales in
Q93: The following graph shows the supply of
Q94: If the quantity of burgers supplied increases
Unlock this Answer For Free Now!
View this answer and more for free by performing one of the following actions

Scan the QR code to install the App and get 2 free unlocks

Unlock quizzes for free by uploading documents