Refer to the graphs shown. Assume the graph reflects demand in the automobile market. Which arrow best captures the impact of increased gasoline prices on the automobile market? 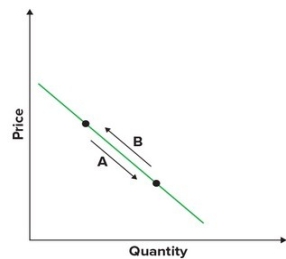
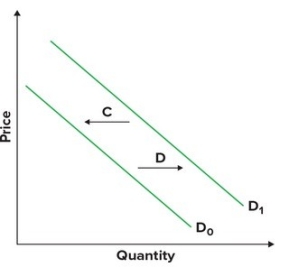
A) A
B) B
C) C
D) D
Correct Answer:
Verified
Q55: Refer to the graphs shown. The curve
Q56: Assume the graph shown reflects demand in
Q57: Given the graph, the quantity that would
Q58: The law of supply states that, other
Q59: Refer to the table that presents
Q61: Refer to the graphs shown. The arrow
Q62: Moore's Law states that the processing power
Q63: When applied to labor markets, the law
Q64: Refer to the graphs shown. If quantity
Q65: Which of the following would be expected
Unlock this Answer For Free Now!
View this answer and more for free by performing one of the following actions

Scan the QR code to install the App and get 2 free unlocks

Unlock quizzes for free by uploading documents