Refer to the graph shown. Area F is: 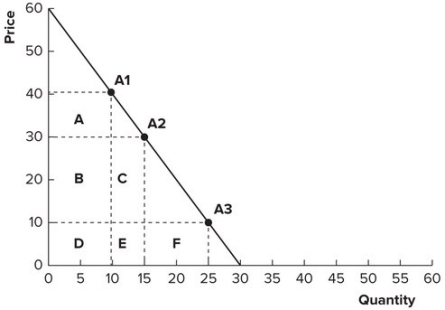
A) smaller than areas B and C, because demand is elastic between $10 and $30.
B) larger than areas B and C, because demand is elastic between $10 and $30.
C) larger than areas B and C, because demand is inelastic between $10 and $30.
D) smaller than areas B and C, because demand is inelastic between $10 and $30.
Correct Answer:
Verified
Q124: The Honolulu tourism commission proposed a 6
Q125: Refer to the graph shown. When price
Q126: Refer to the graph shown. Area C
Q127: It is estimated that a 10 percent
Q128: For normal goods, income elasticity is:
A) greater
Q130: Refer to the graph shown. Between points
Q131: For necessities, income elasticity is any value:
A)
Q132: Refer to the graph shown. At point
Q133: For luxuries, income elasticity is:
A) greater than
Q134: Refer to the graph shown. Total revenue
Unlock this Answer For Free Now!
View this answer and more for free by performing one of the following actions

Scan the QR code to install the App and get 2 free unlocks

Unlock quizzes for free by uploading documents