Refer to the graph shown. When price rises from $10 to $30: 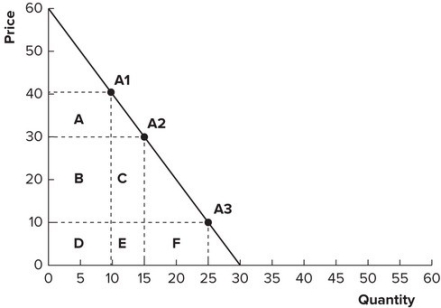
A) lost revenue is represented by areas B and C and gained revenue is represented by area F.
B) gained revenue is represented by areas B and C and lost revenue is represented by area F.
C) lost revenue is represented by areas B, C, and D and gained revenue is represented by area A.
D) gained revenue is represented by areas B, C, and D and lost revenue is represented by area A.
Correct Answer:
Verified
Q134: Refer to the graph shown. Total revenue
Q135: Along a straight-line demand curve, total revenue
Q136: An economist estimates that with every 15
Q137: An economist estimates that with every 20
Q138: An economist estimates that on average, for
Q140: Refer to the graph shown. Between points
Q141: College students tend to eat more ramen
Q142: It is estimated that a 5 percent
Q143: When the price of a good increases,
Q144: If milk and cookies are complements and
Unlock this Answer For Free Now!
View this answer and more for free by performing one of the following actions

Scan the QR code to install the App and get 2 free unlocks

Unlock quizzes for free by uploading documents