Refer to the graph shown. After an increase in supply, the market is in equilibrium where the demand curve intersects S1. In this new equilibrium, consumer surplus is equal to: 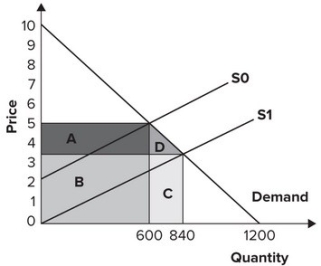
A) 1,260.
B) 1,500.
C) 2,700.
D) 2,940.
Correct Answer:
Verified
Q145: Refer to the graph shown. With an
Q146: Refer to the graph shown. Initially, the
Q147: Government is lobbied to institute price controls
Q148: Refer to the graph shown. When market
Q149: Refer to the graph shown. With an
Q151: When demand is highly inelastic and supply
Q152: Refer to the graph shown. An effective
Q153: As a result of advances in productivity,
Q154: Refer to the graph shown. When market
Q155: Refer to the graph shown. After an
Unlock this Answer For Free Now!
View this answer and more for free by performing one of the following actions

Scan the QR code to install the App and get 2 free unlocks

Unlock quizzes for free by uploading documents