Refer to the graph shown. With an effective price ceiling at $3, the quantity supplied: 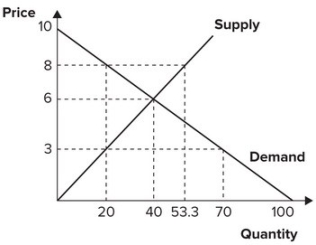
A) falls from 70 to 40.
B) falls from 40 to 20.
C) increases from 40 to 70.
D) increases from 20 to 40.
Correct Answer:
Verified
Q127: Refer to the following graph. 
Q128: Refer to the graph shown. With an
Q129: Refer to the graph shown. With an
Q130: Refer to the graph shown. An effective
Q131: Refer to the graph shown. With an
Q133: Refer to the graph shown. If the
Q134: Refer to the graph shown. An effective
Q135: Refer to the graph shown. With an
Q136: Refer to the graph shown. An effective
Q137: Refer to the graph shown. An effective
Unlock this Answer For Free Now!
View this answer and more for free by performing one of the following actions

Scan the QR code to install the App and get 2 free unlocks

Unlock quizzes for free by uploading documents