Refer to the graph shown. When the market is in equilibrium, producer surplus is area: 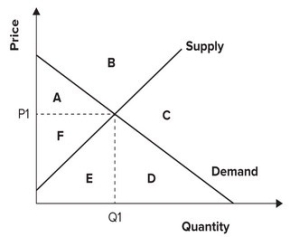
A) A.
B) F.
C) A plus area F.
D) D plus area E plus area F.
Correct Answer:
Verified
Q18: If the demand for Insulin is highly
Q19: Total consumer surplus is measured as the
Q20: If a tax is legally required to
Q21: Refer to the graph shown. If the
Q22: Refer to the graph shown. If consumers
Q24: Refer to the graph shown. When the
Q25: Refer to the graph shown. When the
Q26: Refer to the graph shown. The difference
Q27: Refer to the graph shown. When the
Q28: Refer to the graph shown. If the
Unlock this Answer For Free Now!
View this answer and more for free by performing one of the following actions

Scan the QR code to install the App and get 2 free unlocks

Unlock quizzes for free by uploading documents