Refer to the graph shown. This set of cost curves is: 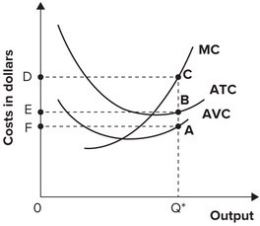
A) correct.
B) wrong because the ATC should be below the AVC.
C) wrong because the marginal cost curve should go through the minimum points of the ATC and AVC curves in that order.
D) wrong because the marginal cost curve should not intersect the average total cost curve.
Correct Answer:
Verified
Q116: Refer to the table shown. The
Q117: The total fixed cost curve is:
A) upward
Q118: Refer to the table shown. Marginal
Q119: The vertical distance between the average total
Q120: A firm's total variable cost increases from
Q122: Refer to the graph shown. Total variable
Q123: Refer to the graph shown. The line
Q124: Which of the following cost curves is
Q125: When production increases, the average variable cost
Q126: At very high levels of output, total
Unlock this Answer For Free Now!
View this answer and more for free by performing one of the following actions

Scan the QR code to install the App and get 2 free unlocks

Unlock quizzes for free by uploading documents