Refer to the following graphs. 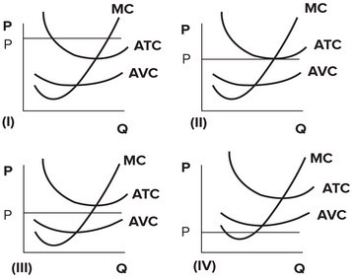 Which graph depicts a perfectly competitive firm that will minimize short-run losses by producing zero output?
A) Graph I
B) Graph II
C) Graph III
D) Graph IV
Correct Answer:
Verified
Q86: Suppose that the firms in the perfectly
Q87: Refer to the graph shown. Assuming that
Q88: Suppose there are 50 firms in a
Q89: In the wake of the 2008 recession,
Q90: Refer to the graph shown. Assuming that
Q92: Long-run competitive equilibrium in an industry implies
Q93: Assume that the home construction industry is
Q94: Refer to the graph shown. Assuming that
Q95: Refer to the following graph. 
Q96: Suppose that the firms in the perfectly
Unlock this Answer For Free Now!
View this answer and more for free by performing one of the following actions

Scan the QR code to install the App and get 2 free unlocks

Unlock quizzes for free by uploading documents