Refer to the graph shown. Area C represents: 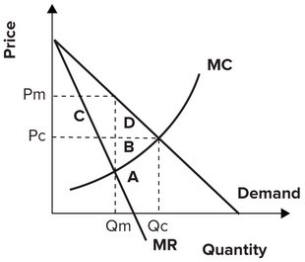
A) the total loss of surplus by consumers resulting from a monopoly.
B) the cost to society of increasing output from Qm to Qc.
C) consumer surplus redistributed to the monopolist.
D) the loss of surplus by producers resulting from a monopoly.
Correct Answer:
Verified
Q56: Refer to the table shown, which
Q57: Refer to the graph shown. The profit-maximizing
Q58: Refer to the graph shown. If this
Q59: Refer to the graph shown. If the
Q60: Refer to the table shown, which
Q62: Suppose a monopolist is at the profit-maximizing
Q63: Refer to the graph shown. Assuming that
Q64: Under normal monopoly, price exceeds marginal cost,
Q65: Refer to the graph shown. If the
Q66: Refer to the graph shown. If hamburgers
Unlock this Answer For Free Now!
View this answer and more for free by performing one of the following actions

Scan the QR code to install the App and get 2 free unlocks

Unlock quizzes for free by uploading documents