Refer to the graph shown. 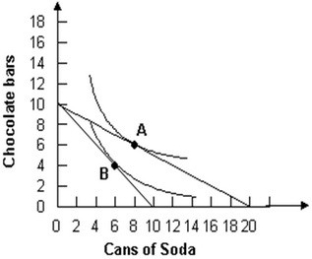 The diagram demonstrates that an increase in the price of soda will:
A) raise the quantity demanded of soda.
B) reduce the quantity demanded of soda.
C) raise the quantity demanded of chocolate bars.
D) raise the consumer's available income.
Correct Answer:
Verified
Q124: Using indifference curve analysis, you can identify
Q125: Refer to the graphs shown. 
Q126: Refer to the graphs shown, which show
Q127: Refer to the graph shown.
Q128: Refer to the graph shown.
Q129: Refer to the graph shown.
Q130: Refer to the graphs shown.
Q131: Refer to the graph shown. A consumer
Q133: Refer to the graphs shown, which show
Q134: Refer to the graphs shown, which show
Unlock this Answer For Free Now!
View this answer and more for free by performing one of the following actions

Scan the QR code to install the App and get 2 free unlocks

Unlock quizzes for free by uploading documents