The diagram was intended to illustrate the MC and AVC curves that correspond to each other. Explain why the diagram below is incorrect. 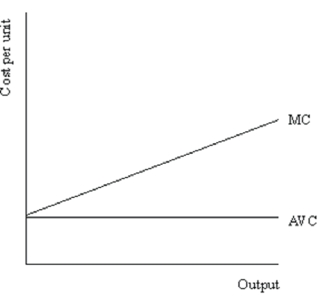
Correct Answer:
Verified
View Answer
Unlock this answer now
Get Access to more Verified Answers free of charge
Q23: Draw and correctly label a typical set
Q24: The diagram below shows the production
Q25: Demonstrate graphically and explain verbally why the
Q26: You are given that the total cost
Q27: To make sure that you understand
Q29: (a) Calculate marginal costs, total costs,
Q30: The diagram was intended to illustrate the
Q31: You are given that the average variable
Q32: Congratulations! You have just been promoted
Q33: You have been hired by the
Unlock this Answer For Free Now!
View this answer and more for free by performing one of the following actions

Scan the QR code to install the App and get 2 free unlocks

Unlock quizzes for free by uploading documents