Monthly sales were tracked and shown on the graph below. 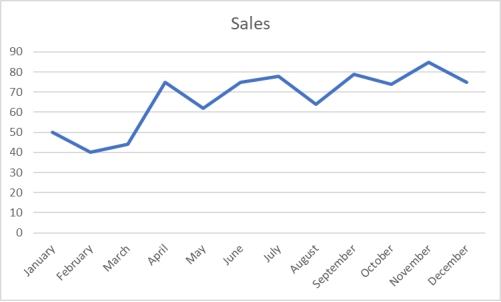 Based on this graph, which month had the highest sales?
A) April
B) July
C) February
D) November
E) December
Correct Answer:
Verified
Q103: The following time-series data shows the
Q104: To show hourly sales throughout a day,
Q105: A shirt production company has tracked their
Q106: Monthly sales were tracked and shown on
Q107: A shirt production company has tracked their
Q108: A shirt production company has tracked their
Q109: Sales are tracked during the past year
Q111: A shirt production company has tracked their
Q112: Sales are tracked during the past year
Q113: A shirt production company has tracked their
Unlock this Answer For Free Now!
View this answer and more for free by performing one of the following actions

Scan the QR code to install the App and get 2 free unlocks

Unlock quizzes for free by uploading documents